Since it took quite a bit of searching here's a short post on using Open Chip Debugging with KDevelop and mbed-os on the STM32H7. I'm using the NUCLEO-H743ZI2 dev board which uses st-link v3.
1. First, download and build the most recent openocd from sourceforge as the current release does not have support for the STM32H7.
git clone git@github.com:ntfreak/openocd.git
cd openocd
./bootstrap
./configure [options]
make
sudo make install
Now you should be able to run it and it will indicate the dev version.
$ openocd --version
Open On-Chip Debugger 0.10.0+dev-00910-g4dbcb1e7 (2019-06-18-18:41)
Licensed under GNU GPL v2
For bug reports, read
        http://openocd.org/doc/doxygen/bugs.html
2. Install the arm cross compiler from this ppa https://launchpad.net/gcc-arm-embedded to get a recent version
3. Next, download and install the mbed-cli and create a new project as described in the docs.
4. Open the project with KDevelop as custom build system project. Go to the project configuration and add the following build command (update the board as needed).
mbed compile --toolchain GCC_ARM --target NUCLEO_H743ZI --build build/ --profile mbed-os/tools/profiles/debug.json
So set mbed as the executable and the rest as arguments.
Note: If the debug profile is not used you wont be able to see any variables
5. Create a gdb script with the following. Replace your-project-name as needed.
target remote localhost:3333

# monitor arm semihosting enable
mon reset halt
# openocd must be running in the correct dir for the relative paths to work

# Flash
mon flash write_image erase unlock build/your-project-name.bin 0x08000000
mon verify_image build/your-project-name.bin 0x08000000
mon reset halt


# Not sure why but this is needed for KDevelop
file build/your-project-name.elf
load
mon reset halt
disconnect
target remote localhost:3333
6. Now in KDevelop, select Run -> Configure Launches and add a new compiled binary launch type. For the target set it to executable and the path to build/your-project-name.elf . Click on the Debug part of the launch configuration and set the debugger executable to /usr/bin/arm-none-eabi-gdb. Set the Run gdb script to the script created in the previous step. Click apply.
Now it should be ready for debugging. Plug in the board and start OpenOCD in a separate console with in the project folder.
1. Run openocd with your link and target files
openocd -f interface/stlink.cfg -f board/stm32h7x3i_eval.cfg
You should see something like this
$ openocd -f interface/stlink.cfg -f board/stm32h7x3i_eval.cfg
Open On-Chip Debugger 0.10.0+dev-00910-g4dbcb1e7 (2019-06-18-18:41)
Licensed under GNU GPL v2
For bug reports, read
        http://openocd.org/doc/doxygen/bugs.html
Warn : Interface already configured, ignoring
Error: already specified hl_layout stlink
Info : The selected transport took over low-level target control. The results might differ compared to plain JTAG/SWD
srst_only separate srst_nogate srst_open_drain connect_deassert_srst

Info : Listening on port 6666 for tcl connections
Info : Listening on port 4444 for telnet connections
Info : clock speed 1800 kHz
Info : STLINK V3J2M1 (API v3) VID:PID 0483:374E
Info : Target voltage: 3.286056
Info : stm32h7x.cpu: hardware has 8 breakpoints, 4 watchpoints
Info : Listening on port 3333 for gdb connections
2. Now build your project in KDevelop
3. Then click Debug, it should flash and halt at the startup code. It should output something like
target halted due to debug-request, current mode: Thread
xPSR: 0x01000000 pc: 0x080050fc msp: 0x20020000
stm32x_protect, option_bytes written WRP1 0xff , WRP2 0xff
auto erase enabled
auto unlock enabled
wrote 262144 bytes from file build/your-project-name.bin in 2.780978s (92.054 KiB/s)
verified 141504 bytes in 0.159351s (867.189 KiB/s)
target halted due to debug-request, current mode: Thread
xPSR: 0x01000000 pc: 0x08009a0c msp: 0x20020000
target halted due to debug-request, current mode: Thread
xPSR: 0x01000000 pc: 0x08009a0c msp: 0x20020000
halted: PC: 0x080137c4
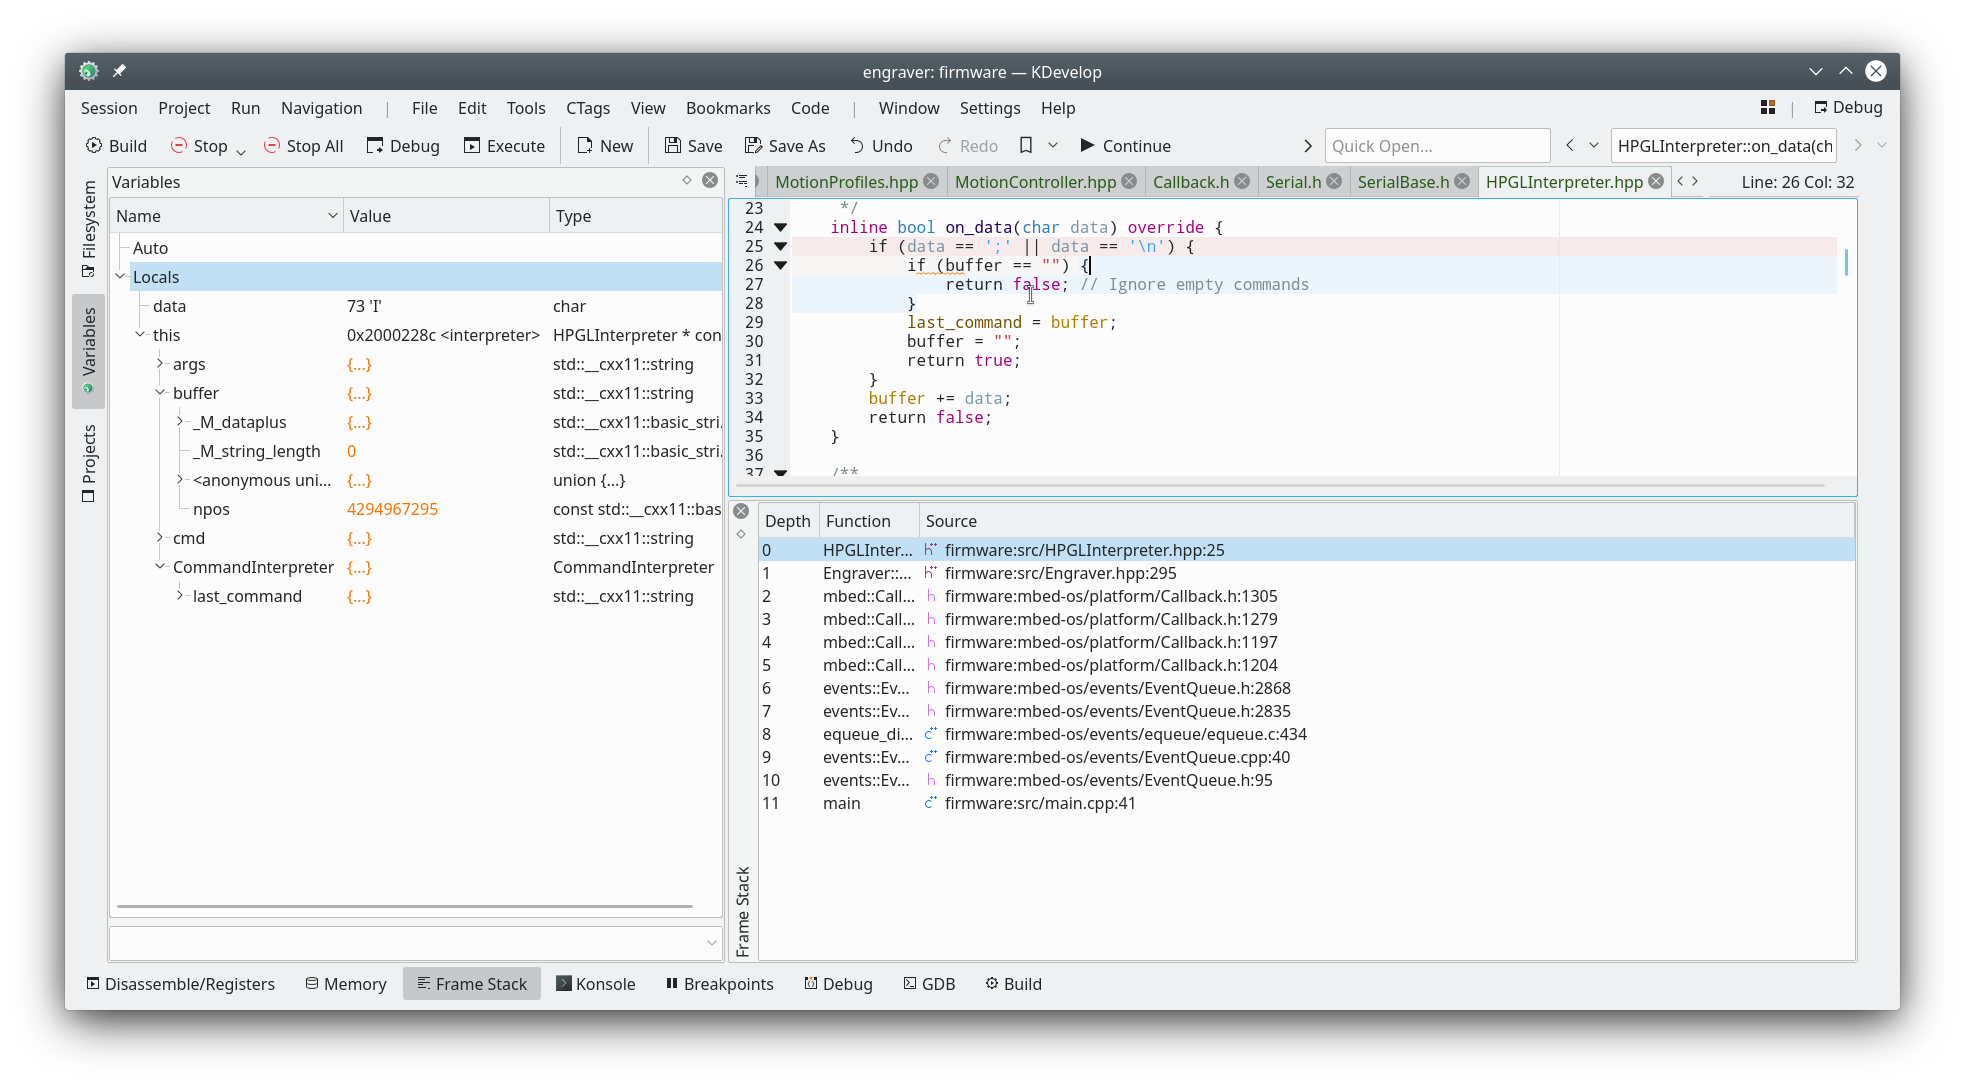
4. Click continue and set breakpoints as needed and step through using the awesome KDevelop debugger interface
I'd also recommend exporting the mbed project as a cmake project and copying all the include directories so the kdevelop parser gives code hinting. Then you can use Kdevelop as full IDE and debugger and avoid all that java/eclipse nonsense that uses 5x the memory!
If you get errors like
Info : Previous state query failed, trying to reconnect
Error: jtag status contains invalid mode value - communication failure
Polling target stm32h7x.cpu failed, trying to reexamine
Examination failed, GDB will be halted. Polling again in 6300ms
Try to:
1. Unplug the board and replug it in, then restart openocd
2. Hold the reset button, then restart openocd
3. Run openocd with gdb_memory_map disable